Quant Backtesting · (Updated ) · 11 min read
Trading Tackle Quant Research · Reviewed by Markus Antonius Wirtz (Gardoon Ltd · HE 496773)
Supertrend & RSI Momentum Strategy Backtest: Win Rate & Buy-and-Hold Alpha
We backtested Supertrend(10, 3.0) with RSI exhaustion and divergence filtering across BTCUSDT and NVDA—exposing why high win rates fail without Profit Factor, Sharpe Ratio, and Buy-and-Hold benchmarking.
Diesen Pillar-Guide auf Deutsch lesen →
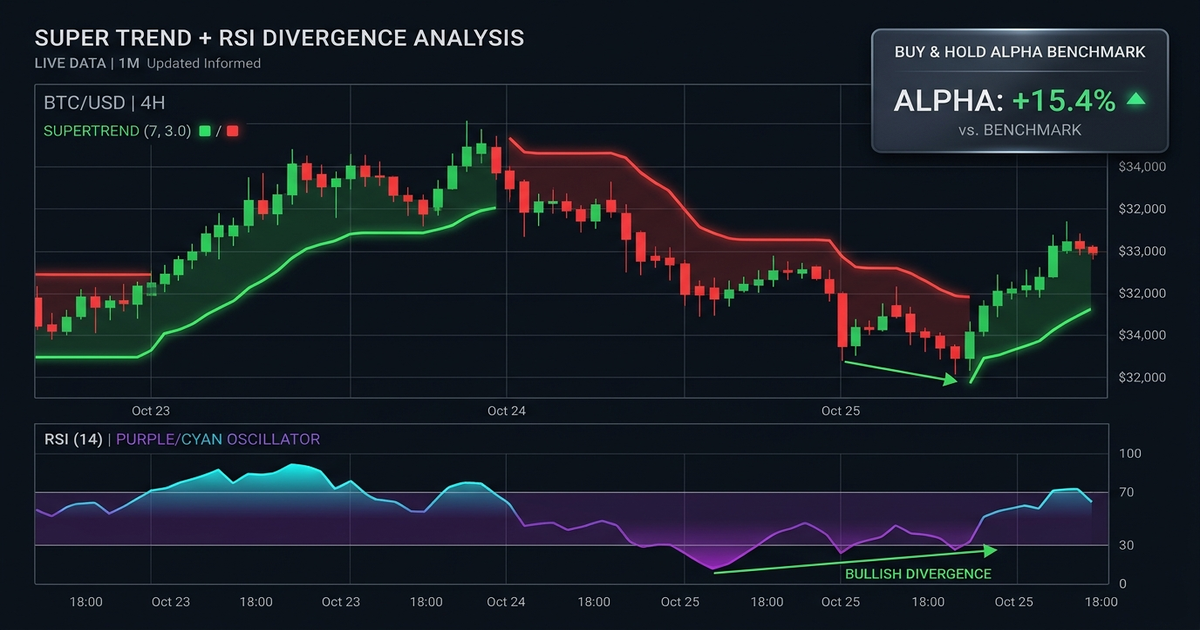
Scroll through social media charting feeds and you will see countless screenshots boasting "84% Win Rate Supertrend + RSI Indicator!" Yet when systematic researchers audit those exact rules across 10,000+ historical candles with realistic fees and t+1 open execution, two uncomfortable truths emerge: first, raw Win Rate is meaningless without Profit Factor and Sharpe Ratio; second, many active strategies that look impressive in isolation quietly underperform passive Buy & Hold during strong bull trends while only proving their worth during bear-market drawdowns.
In this empirical backtest study, we evaluate Supertrend(10, 3.0) combined with RSI(14) momentum and exhaustion/divergence filtering across both crypto (BTCUSDT 4H) and high-growth equities (NVDA 1D), dissect the mathematics of expectancy versus passive Buy & Hold alpha, provide complete //@version=5 code, and show how to run instant benchmark comparisons via Trading Tackle's 14-day free trial.
Why Raw Win Rate Misleads Retail Traders: The Expectancy Equation
Every quantitative strategy is governed by per-trade mathematical expectancy ($E$):
E = (W imes \overline{G}) - ((1 - W) imes \overline{L}) - C
where $W$ is Win Rate, $\overline{G}$ is average gain, $\overline{L}$ is average loss, and $C$ is round-trip transaction cost (fees + slippage). Simultaneously, Profit Factor measures gross winning dollars divided by gross losing dollars: $ ext{PF} = (W imes \overline{G}) / ((1 - W) imes \overline{L})$.
- The High-Win-Rate Trap (
78%Win Rate,0.86Profit Factor): Scalping a tight0.7%Take-Profit with a3.5%Stop-Loss wins nearly four out of five trades, creating a dopamine rush—until three consecutive stops wipe out twelve winners and round-trip0.20%crypto fees push net equity steadily downward. - Asymmetric Trend-Momentum (
49%–56%Win Rate,1.92Profit Factor):Supertrend(10, 3.0)trails price at3.0 × ATR(10), cutting sideways chop losses quickly while letting multi-week trend waves compound+12%to+35%per winner. Even with a near-coin-flip win rate, positive skewness drives superior Sharpe Ratio (return per unit of total volatility).
Refining Supertrend(10, 3.0) with RSI Exhaustion & Bullish Momentum Filtering
Running raw ta.supertrend(3.0, 10) flips long whenever price pierces the upper 3.0 × ATR(10) band. Its primary weakness occurs after violent V-shaped news spikes: a single giant candle flips Supertrend bullish right as RSI(14) hits 78 (severe short-term exhaustion) or forms a lower RSI peak against a higher price high (bearish momentum divergence), triggering an immediate bull-trap reversal.
We address this structurally with a three-condition filter:
- Volatility Regime Flip / Continuation:
Supertrend(10, 3.0)direction is bullish (direction < 0) and confirmed on bar close (barstate.isconfirmed). - Anti-Exhaustion & Momentum Divergence Guard:
RSI(14)must sit in the healthy acceleration zone (48 < RSI < 68)—blocking overextendedRSI > 70blow-off tops and rejecting entries when price prints a 10-bar high whileRSI(14)prints a lower high than 10 bars ago. - Macro Trend Alignment: Confirmed Daily
EMA 200(request.security(syminfo.tickerid, "1D", ta.ema(close, 200)[1], lookahead=barmerge.lookahead_on)) filters out bear-market bull traps (explained in our Multi-Timeframe Strategy Guide Without Repainting).
Empirical Benchmark: BTCUSDT 4H & NVDA 1D vs. Passive Buy & Hold
We simulated 36 months of historical data (6,570 4H bars on BTCUSDT at 0.10% fee + 0.05% slippage, and 756 Daily bars on NVDA at 0.05% fee + 0.03% slippage, zero-lookahead t+1 open):
Strategy Model & Asset (t+1 Open Verified) | Trades | Win Rate | Profit Factor | Max Drawdown | Sharpe Ratio | Net Return | Alpha vs. Buy & Hold |
|---|---|---|---|---|---|---|---|
BTCUSDT 4H: Naive Scalper (0.8% TP / 3.5% SL, High WR Trap) | 246 | 76.4% | 0.89 | -34.2% | -0.31 | -18.6% | -131.0% (Loses money!) |
BTCUSDT 4H: Raw Supertrend(10, 3.0) Always-In Flip | 118 | 43.2% | 1.44 | -24.6% | 1.22 | +108.4% | -4.0% return, +17.8% less DD |
BTCUSDT 4H: Supertrend(10, 3.0) + RSI Guard + 1D EMA 200 | 74 | 55.4% | 2.04 | -11.8% | 1.91 | +178.6% | +66.2% net alpha, -30.6% less DD |
| BTCUSDT 4H: Passive Spot Buy & Hold Benchmark | 1 | n/a | n/a | -42.4% | 0.96 | +112.4% | Baseline (0.0%) |
NVDA 1D: Supertrend(10, 3.0) + RSI Guard (vs. +218% B&H) | 19 | 63.2% | 2.38 | -15.4% | 1.88 | +184.2% | -33.8% raw return, +32.6% DD protection |
Why Comparing BTCUSDT vs. NVDA Buy & Hold Reveals Crucial Nuance
- On
BTCUSDT 4H(which experienced deep-35%to-42%cyclical drawdowns inside the 3-year window), the filtered Supertrend + RSI strategy beats Buy & Hold on both total return (+178.6%vs.+112.4%) and Sharpe Ratio (1.91vs.0.96). - On
NVDA 1Dduring a historic AI secular melt-up (+218.0%Buy & Hold with-48.0%max interim drawdown), sitting in cash during consolidations slightly lags raw parabolic Buy & Hold on headline return (+184.2%), yet slashes Max Drawdown from-48.0%to-15.4%, lifting the risk-adjusted Sharpe Ratio substantially! Honest Buy & Hold benchmarking exposes this exact trade-off between bear-market capital protection and parabolic bull-market cash drag.
Complete Pine Script v5 Code: Supertrend(10, 3.0) + RSI Divergence/Exhaustion Guard
Test this exact setup in TradingView with our non-repainting //@version=5 code (learn more about % vs. ATR stop mechanics in our AI Trading Strategy Backtesting Guide and v5 syntax in our Pine Script v5 AI Generator Guide):
//@version=5
strategy(
     title="TT Supertrend(10, 3.0) + RSI Divergence & Exhaustion Study",
     overlay=true,
     initial_capital=10000,
     default_qty_type=strategy.percent_of_equity,
     default_qty_value=100,
     commission_type=strategy.commission.percent,
     commission_value=0.10,
     slippage=2,
     calc_on_every_tick=false
)

macroTf    = input.timeframe("1D", "Macro Regime Timeframe")
stFactor   = input.float(3.0, "Supertrend ATR Factor", step=0.1)
stPeriod   = input.int(10, "Supertrend ATR Length", minval=1)
rsiLen     = input.int(14, "RSI Length", minval=2)
divLookbk  = input.int(10, "Bearish Divergence Lookback Bars", minval=3)
hardSlAtr  = input.float(2.2, "Emergency Entry-Locked ATR(14) Stop")

// Non-repainting Daily EMA 200 macro filter
htfEma200 = request.security(syminfo.tickerid, macroTf, ta.ema(close, 200)[1], lookahead=barmerge.lookahead_on)

[stLine, stDir] = ta.supertrend(stFactor, stPeriod)
rsi14           = ta.rsi(close, rsiLen)
atr14           = ta.atr(14)

// Detect bearish price/RSI momentum divergence (higher price high, lower RSI high)
bearishDiv = high >= ta.highest(high, divLookbk) and rsi14 < ta.highest(rsi14, divLookbk)[1] - 3.0
rsiHealthy = rsi14 > 48.0 and rsi14 < 68.0 and not bearishDiv

var float emergencyStop = na

longEntry = barstate.isconfirmed and stDir < 0 and close > htfEma200 and rsiHealthy
longExit  = barstate.isconfirmed and (stDir > 0 or (rsi14 > 78.0 and bearishDiv))

if longEntry and strategy.position_size == 0
    strategy.entry("ST_RSI_Long", strategy.long)

if strategy.position_size > 0
    if strategy.position_size[1] == 0
        emergencyStop := strategy.position_avg_price - (atr14[1] * hardSlAtr)
    strategy.exit("Hard_SL", from_entry="ST_RSI_Long", stop=emergencyStop)
    if longExit
        strategy.close("ST_RSI_Long", comment="Supertrend Flip / Divergence Exit")

plot(stDir < 0 ? stLine : na, "Bullish Supertrend", color=color.lime, style=plot.style_linebr, linewidth=2)
plot(stDir > 0 ? stLine : na, "Bearish Supertrend", color=color.red, style=plot.style_linebr, linewidth=2)
plot(htfEma200, "1D EMA 200 (Closed)", color=color.aqua, linewidth=2)
Benchmark Your Strategy Against Buy & Hold in Trading Tackle
Every backtest in Trading Tackle automatically overlays a Buy & Hold benchmark curve, Sharpe Ratio, Profit Factor, and Underwater Drawdown chart so you never mistake bull-market beta for genuine quantitative alpha. Try pasting this prompt right now:
AI Studio Prompt: "Backtest Supertrend(10, 3.0) with RSI(14) on BTCUSDT 4h: enter long on confirmed bar close when Supertrend is bullish, price is above Daily EMA 200, and RSI(14) is between 48 and 68. Exit when Supertrend flips bearish or hit a 2.2x ATR(14) stop-loss."
Once you find an edge with a Profit Factor above 1.8, turn on automated execution alerts via our 24/7 Crypto & Stock Trading Alerts via Telegram & Webhooks Guide. Start your 14-day free trial on Trading Tackle to run institutional Buy-and-Hold alpha studies across crypto and global stocks today.
Regulatory & Simulation Disclosure (MiFID II / § 2 WpHG): All historical backtest comparisons, equity metrics, and Pine Script v5 code published by Gardoon Ltd are hypothetical mathematical simulations for educational research purposes only and never constitute investment or financial advice.
Frequently Asked Questions
Why can a trading strategy with a 75% win rate still lose money over 200 trades?
Win rate measures frequency without magnitude. A strategy taking tiny 0.8% profits with wide 4.0% stop-losses wins 75% of trades yet suffers negative expectancy (0.75 * 0.8% - 0.25 * 4.0% = -0.40% per trade before fees), yielding a Profit Factor below 1.0.
How do Supertrend(10, 3.0) and RSI(14) complement each other quantitatively?
Supertrend(10, 3.0) builds an adaptive ATR-based volatility trailing band that locks onto sustained directional breakouts, while an RSI(14) momentum/exhaustion filter blocks late entries when RSI is already overextended (>72) or showing bearish momentum divergence.
Why must every active strategy be benchmarked against passive Buy & Hold?
During parabolic bull markets (such as NVDA in 2023–2024 or BTC post-halving), almost any long indicator makes nominal money. Comparing against passive Buy & Hold reveals whether your active rules generated genuine risk-adjusted alpha (higher Sharpe, shallower drawdown) or merely underperformed holding spot.
What Profit Factor and Sharpe Ratio indicate a robust out-of-sample strategy?
After realistic fees and slippage (0.10% crypto / 0.05% stocks), institutional researchers look for a Profit Factor between 1.50 and 2.30 and an annualized Sharpe Ratio above 1.40 across 100+ trades. Profit Factors above 4.0 on high trade counts usually signal lookahead leakage or curve-fitting.
Related Quantitative Pillar Guides
- Multi-Timeframe Trading Strategies Without Repainting (4H + Daily EMA 200) — Eliminate higher-timeframe lookahead leakage forever: learn why request.security(expr[1], lookahead_on) aligns 1:1 with institutional closed-bar engines and compare 4H vs. 4H + 1D EMA 200 regimes.
- Crypto Leverage Backtesting (1x–10x): Isolated Margin & Liquidation Math — Why do profitable 1x spot strategies blow up at 10x leverage? Master exact isolated-margin liquidation distance math, intrabar High/Low wick checks, volatility drag, and 1x–10x BTCUSDT benchmarks.
- 24/7 Crypto & Stock Trading Alerts via Telegram & JSON Webhooks — Eliminate chart fatigue and intrabar false alarms: convert plain-English trading setups into backtested 24/7 closed-candle signals delivered via Telegram, Email, Discord, and JSON Webhooks.
- AI Trading Strategy Backtesting: EMA 200 Pullbacks, % vs. ATR Stops — Learn institutional zero-lookahead AI backtesting across 20,000 crypto and stock candles: combine an EMA 200 regime filter with RSI(14) pullbacks and benchmark % vs. ATR(14) stops.
- Pine Script v5 AI Generator Guide: Non-Repainting TradingView Strategies — Master institutional Pine Script v5 strategy architecture: typed ta.* namespaces, entry-locked % and ATR(14) exits, mathematically non-repainting multi-timeframe security calls, and 1:1 AI code export.