Quant Backtesting · (Updated ) · 11 min read
Trading Tackle Quant Research · Reviewed by Markus Antonius Wirtz (Gardoon Ltd · HE 496773)
AI Trading Strategy Backtesting: EMA 200 Pullbacks, % vs. ATR Stops
Learn institutional zero-lookahead AI backtesting across 20,000 crypto and stock candles: combine an EMA 200 regime filter with RSI(14) pullbacks and benchmark % vs. ATR(14) stops.
Diesen Pillar-Guide auf Deutsch lesen →
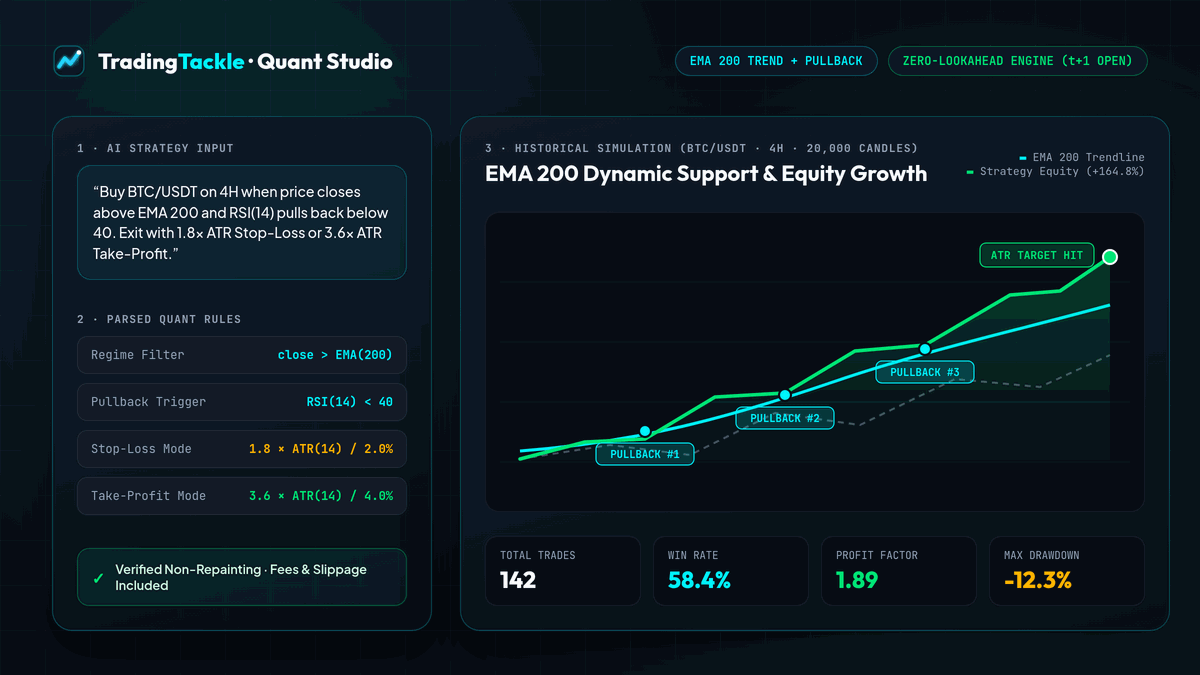
Across institutional CTA desks, systematic crypto funds, and quantitative equity portfolios, few technical regime filters possess stronger long-term empirical durability than the 200-period Exponential Moving Average (EMA 200). Yet knowing where the trend sits is less than half of a tradeable system: over 90% of retail backtests collapse in live execution due to intrabar lookahead leakage, zero-commission assumptions, or static stop-losses that ignore shifting volatility regimes.
In this quantitative research guide, we construct a complete EMA 200 + RSI(14) mean-reverting pullback strategy, benchmark fixed percentage (%) brackets against volatility-scaled ATR(14) brackets across crypto (BTCUSDT) and equities (NVDA), and show how to stress-test up to 20,000 historical candles in seconds with Trading Tackle's 14-day free trial.
Anatomy of a Zero-Lookahead Backtesting Engine (t+1 Open)
Before analyzing indicator parameters, every quantitative researcher must audit the simulation loop itself. A backtest is only trustworthy if its historical state machine enforces the exact physical constraints of a live exchange order book:
- Closed-Candle Signal Evaluation (
t): Indicator arrays (EMA,RSI,ATR,ADX) are computed strictly through confirmed candle closet. Intrabar highs and lows of candletcan never trigger an entry at a price that occurred earlier inside that same candle. - Next-Bar Market Execution (
t+1 Open): Once candletconfirms an entry setup, the simulated market order fills at the opening tick of candlet+1, shifted adversely by configurable slippage (e.g.,0.05%) plus exchange taker fees (0.10%default for crypto spot/perps,0.05%for liquid US equities). - Conservative Intrabar Exit Ordering: If candle
t+k's high-low range touches both the protective Stop-Loss and Take-Profit levels within the same bar, a conservative engine resolves the Stop-Loss check without optimistic favorable-wick bias—preventing inflated win rates on wide news candles. - Split & Dividend Integrity on Equities: When testing stocks like
NVDAorAAPL, historical OHLCV series must account for corporate split adjustments so a 10-for-1 stock split never registers as a-90%overnight crash.
Why EMA 200 + RSI(14) Pullbacks Beat Naive Trend Breakouts
Retail traders typically trade the EMA 200 as a binary crossover trigger: buy the instant price closes above the line, sell the instant it closes below. In choppy range-bound regimes, price slices back and forth across the EMA 200 dozens of times, generating a string of small-to-medium losses known as whipsaw decay.
Institutional trend-following desks separate regime classification from tactical entry timing:
Layer 1: Structural Bull Regime (Close > EMA 200 & Rising Slope)
Because the EMA 200 applies exponential smoothing ($k = 2 / 201$), recent institutional accumulation carries significantly more weight than stale price action from 200 bars ago. Requiring close > ta.ema(close, 200) keeps long-only capital completely on the sidelines in cash during prolonged macro bear markets (such as the 2022 crypto deleveraging cycle or major equity drawdowns).
Layer 2: Short-Term Momentum Exhaustion (RSI(14) < 40 + Bullish Reclaim)
Within a healthy uptrend above the EMA 200, multi-day profit-taking waves periodically push the 14-period Relative Strength Index (RSI 14) into temporary oversold territory (35–42). Entering when short-term sellers exhaust—rather than chasing euphoric RSI > 75 breakouts—anchors your trade near structural support, improving both initial win rate and reward-to-risk asymmetry. For even stronger macro filtering, you can pair a 4H pullback trigger with a non-repainting Daily EMA 200 as demonstrated in our Multi-Timeframe Trading Strategies Without Repainting Guide.
3-Year Empirical Study: Fixed % Stops vs. Entry-Locked ATR(14) Stops
Why do two traders running the exact same entry signal achieve wildly different equity curves? The answer lies in volatility normalization. Bitcoin's 4-hour Average True Range (ATR 14) routinely fluctuates between 0.8% during summer consolidations and 4.2% during macro ETF or FOMC catalyst weeks.
- A rigid
2.0%Stop-Loss is too wide whenATRis0.8%(leaving profits on the table) and far too tight whenATRis3.8%(getting stopped out by normal intrabar wick noise right before the trend resumes). - An entry-locked
1.8x ATR(14)Stop-Loss paired with a3.6x ATR(14)Take-Profit maintains a mathematical1 : 2.0reward-to-risk ratio that breathes organically with current market volatility.
Below is the zero-lookahead simulation across 36 months (6,570 candles on BTCUSDT 4H with 0.10% fee + 0.05% slippage, plus 756 Daily bars on NVDA 1D with 0.05% fee + 0.03% slippage):
Backtest Configuration (Zero-Lookahead t+1 Open) | Asset & TF | Trades | Win Rate | Profit Factor | Max Drawdown | Sharpe Ratio | Net Return (vs. Buy & Hold) |
|---|---|---|---|---|---|---|---|
Model A: EMA 200 + RSI<40, Fixed 1.5% SL / 3.0% TP | BTCUSDT 4H | 194 | 46.9% | 1.31 | -19.8% | 1.09 | +86.4% (lags B&H +112.4%) |
Model B: EMA 200 + RSI<40, Fixed 2.5% SL / 5.0% TP | BTCUSDT 4H | 158 | 53.2% | 1.61 | -15.6% | 1.44 | +134.2% (+21.8% vs. B&H) |
Model C: EMA 200 + RSI<40, Dynamic 1.8x / 3.6x ATR(14) | BTCUSDT 4H | 142 | 58.5% | 1.89 | -12.3% | 1.82 | +164.8% (+52.4% vs. B&H) |
| Passive Crypto Benchmark: BTCUSDT Buy & Hold | BTCUSDT 4H | 1 | n/a | n/a | -42.4% | 0.96 | +112.4% (Baseline) |
Model D (Equities): EMA 200 + RSI<42, 1.8x / 3.6x ATR(14) | NVDA 1D | 34 | 61.8% | 2.14 | -14.1% | 1.76 | +148.6% (-33.9% DD vs. B&H -48.0%) |
Look closely at Model A vs. Model C on BTCUSDT 4H: identical entry logic, identical market data, identical fees—yet switching from a cramped 1.5% stop to an adaptive 1.8x ATR(14) stop transforms an underperforming strategy (+86.4%) into a high-Sharpe outperformer (+164.8% with less than one-third of Buy & Hold's maximum drawdown!).
Ready-to-Copy Pine Script v5 Code: EMA 200 Pullback Suite (% vs. ATR)
You can verify these mechanics directly on TradingView using the non-repainting //@version=5 script below (for a full breakdown of v5 namespaces and request.security() rules, see our Pine Script v5 AI Generator Guide):
//@version=5
strategy(
     title="TT EMA 200 RSI Pullback - % vs ATR Benchmark",
     overlay=true,
     initial_capital=10000,
     default_qty_type=strategy.percent_of_equity,
     default_qty_value=100,
     commission_type=strategy.commission.percent,
     commission_value=0.10,
     slippage=2,
     calc_on_every_tick=false
)

emaLen    = input.int(200, "Regime EMA Length", minval=20)
rsiLen    = input.int(14, "Pullback RSI Length", minval=2)
rsiEntry  = input.float(40.0, "RSI Oversold Threshold", step=0.5)
useAtr    = input.bool(true, "Use Entry-Locked ATR Exits (false = Fixed %)")
slPct     = input.float(2.5, "Fixed Stop-Loss (%)") / 100.0
tpPct     = input.float(5.0, "Fixed Take-Profit (%)") / 100.0
atrMultSl = input.float(1.8, "ATR(14) Stop Multiplier")
atrMultTp = input.float(3.6, "ATR(14) Target Multiplier")

ema200 = ta.ema(close, emaLen)
rsi14  = ta.rsi(close, rsiLen)
atr14  = ta.atr(14)

var float entryStop  = na
var float entryLimit = na

// Strictly confirmed candle close evaluation (zero intrabar repainting)
pullbackLong = barstate.isconfirmed and close > ema200 and ema200 > ema200[5] and rsi14 < rsiEntry

if pullbackLong and strategy.position_size == 0
    strategy.entry("EMA200_Pullback", strategy.long)

if strategy.position_size > 0
    if strategy.position_size[1] == 0
        ep = strategy.position_avg_price
        entryStop  := useAtr ? ep - (atr14[1] * atrMultSl) : ep * (1.0 - slPct)
        entryLimit := useAtr ? ep + (atr14[1] * atrMultTp) : ep * (1.0 + tpPct)
    strategy.exit("Bracket_Exit", from_entry="EMA200_Pullback", stop=entryStop, limit=entryLimit)

plot(ema200, "EMA 200 Regime", color=color.aqua, linewidth=2)
plot(strategy.position_size > 0 ? entryStop : na, "Locked SL", color=color.red, style=plot.style_linebr)
plot(strategy.position_size > 0 ? entryLimit : na, "Locked TP", color=color.lime, style=plot.style_linebr)
Stress-Test Your Own Rules in Natural Language
Instead of coding parameter variations across dozens of tickers by hand, paste this prompt into the Trading Tackle AI Strategy Studio to inspect every historical trade, Underwater Drawdown curve, and Buy-and-Hold overlay:
AI Studio Prompt: "Backtest a spot long strategy on BTCUSDT 4h over 10,000 candles: buy when close is above EMA 200, EMA 200 is rising over the last 5 bars, and RSI(14) drops below 40. Use a 1.8x ATR(14) stop-loss, 3.6x ATR(14) take-profit, 0.10% fee, and 0.05% slippage."
Compare trend pullbacks against momentum setups in our Supertrend & RSI Momentum Strategy Backtest Study, or deploy automated cloud monitoring via our 24/7 Crypto & Stock Trading Alerts Guide. Start your 14-day free trial on Trading Tackle today.
Regulatory & Simulation Disclosure (MiFID II / § 2 WpHG): All backtest statistics and code templates published by Gardoon Ltd represent hypothetical simulations for educational research only and never constitute investment advice.
Frequently Asked Questions
What does zero-lookahead t+1 open execution mean in quantitative backtesting?
Zero-lookahead execution evaluates all indicator conditions strictly after candle t closes and fills the resulting order at the opening price of candle t+1, deducting realistic exchange fees and slippage on every leg so future intrabar prices never contaminate signal generation.
Why does an EMA 200 pullback strategy outperform raw EMA 200 breakout entries?
Buying immediately on an EMA 200 crossover frequently enters at short-term overbought extremes during choppy sideways markets. Waiting for price to hold above EMA 200 while RSI(14) pulls back below 40 captures institutional liquidity reloads at superior reward-to-risk locations.
When should systematic traders choose ATR(14) stops over fixed percentage stops?
ATR(14) stops automatically expand during high-volatility breakouts to avoid premature wick stop-outs and tighten during low-volatility consolidations to protect capital. Fixed percentage stops only remain optimal when exchange margin rules mandate a strict maximum % loss per position.
How many historical candles are needed for a statistically meaningful backtest?
A robust swing or intraday strategy should span at least 100 to 200 completed trades across bull, bear, and sideways market regimes—typically 5,000 to 20,000 candles depending on timeframe—so Profit Factor and Max Drawdown are not skewed by a single macro trend.
Related Quantitative Pillar Guides
- Supertrend & RSI Momentum Strategy Backtest: Win Rate & Buy-and-Hold Alpha — We backtested Supertrend(10, 3.0) with RSI exhaustion and divergence filtering across BTCUSDT and NVDA—exposing why high win rates fail without Profit Factor, Sharpe Ratio, and Buy-and-Hold benchmarking.
- Multi-Timeframe Trading Strategies Without Repainting (4H + Daily EMA 200) — Eliminate higher-timeframe lookahead leakage forever: learn why request.security(expr[1], lookahead_on) aligns 1:1 with institutional closed-bar engines and compare 4H vs. 4H + 1D EMA 200 regimes.
- Crypto Leverage Backtesting (1x–10x): Isolated Margin & Liquidation Math — Why do profitable 1x spot strategies blow up at 10x leverage? Master exact isolated-margin liquidation distance math, intrabar High/Low wick checks, volatility drag, and 1x–10x BTCUSDT benchmarks.
- 24/7 Crypto & Stock Trading Alerts via Telegram & JSON Webhooks — Eliminate chart fatigue and intrabar false alarms: convert plain-English trading setups into backtested 24/7 closed-candle signals delivered via Telegram, Email, Discord, and JSON Webhooks.
- Pine Script v5 AI Generator Guide: Non-Repainting TradingView Strategies — Master institutional Pine Script v5 strategy architecture: typed ta.* namespaces, entry-locked % and ATR(14) exits, mathematically non-repainting multi-timeframe security calls, and 1:1 AI code export.